Your Market Framework

The Real Nature of Market Behavior
Having an understanding and framework of how the markets really work will allow you to interpret their behavior better, and form the foundation of a much better trading plan.
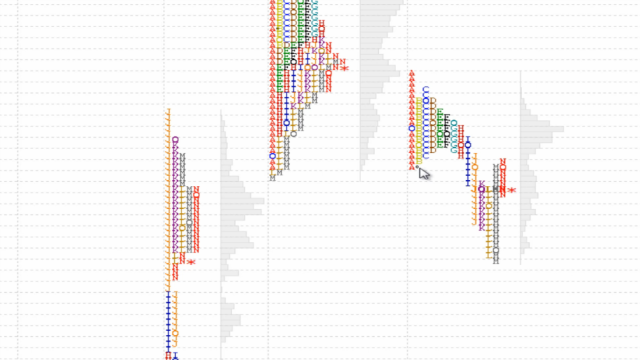
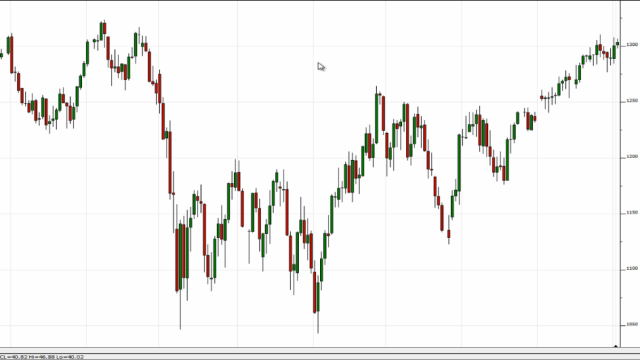
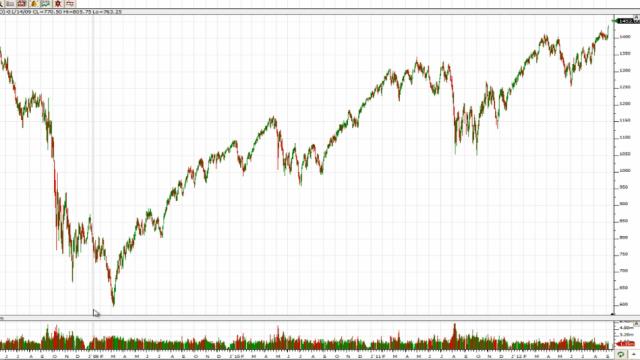
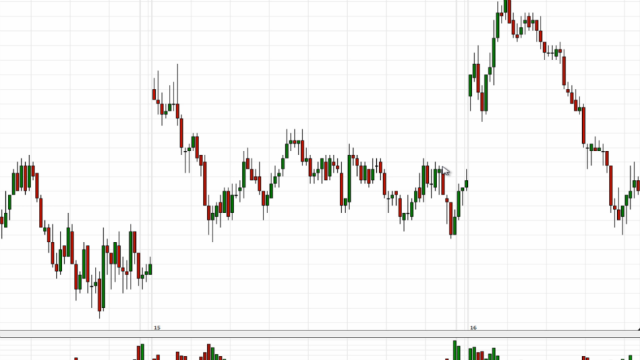
Chart Types to Depict Market Behavior
Being able to interpret two different types of charts will give you a deep perspective from which to view the markets. Most traders only look at the market from a one-dimensional view, so being able to interpret market behavior from two different perspectives gives you an edge, and allows you to make better judgments about what the market is likely to do.
Gauging the State of The Market
Being able to see the markets from within a logical and structured framework makes them much easier to understand and decipher correctly. While most traders are obsessed with patterns and indicators, you’ll be in a position to know what’s really happening beneath the surface and to stay on the right side of market action.
The 10 Laws of Market Dynamics (Part 1)
Once you understand the major laws that govern financial market behavior, you will be equipped with deeper knowledge of how things really work. These laws will serve as a great foundation for developing trading setup with a true edge, while helping avoid typical mistakes made by those traders who are not aware of the laws and act counter to them.
The 10 Laws of Market Dynamics (Part 2)
Once you understand the major laws that govern financial market behavior, you will be equipped with deeper knowledge of how things really work. These laws will serve as a great foundation for developing trading setup with a true edge, while helping avoid typical mistakes made by those traders who are not aware of the laws and act counter to them.
Understanding Volatility and How to Measure It
Understanding volatility is one of the major keys to eventually trading the market profitably. Most traders are unaware of its various effects, and fail to continuously measure it and adapt their trading based on the volatility environment. Learning these foundations will serve you greatly when we get into strategy and tactics.
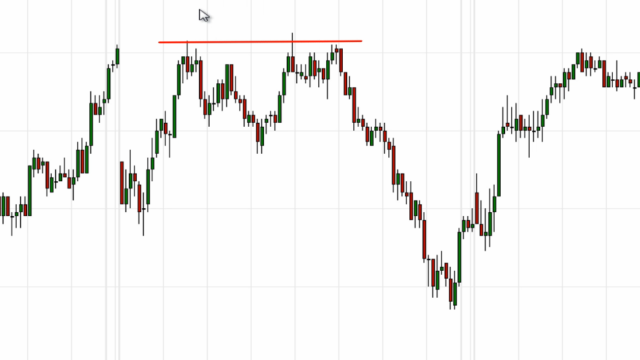
Reading the Market Using Key Reference Areas (Part 1)
Once you can pinpoint these two major key reference areas and know how to interpret price behavior with regards to them, your understanding of market behavior as a whole will be greatly improved. Zeroing in on these key reference areas will also allow you to become much more adept at deciphering the odds of different scenarios unfolding. Instead of looking at a chart and waiting for patterns and indicators to line up, you’ll be looking beneath the surface and gauging what the other market players are doing and who is in control of the markets. This will make all the difference in your market understanding and trading.
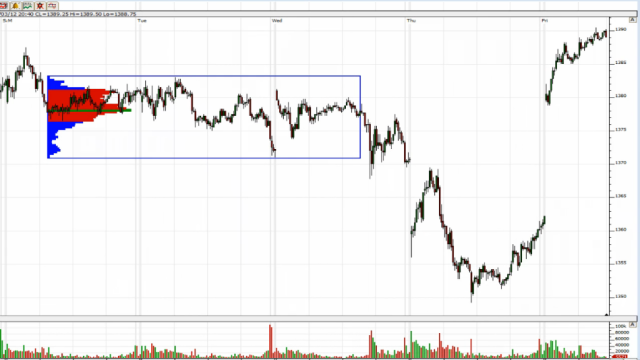
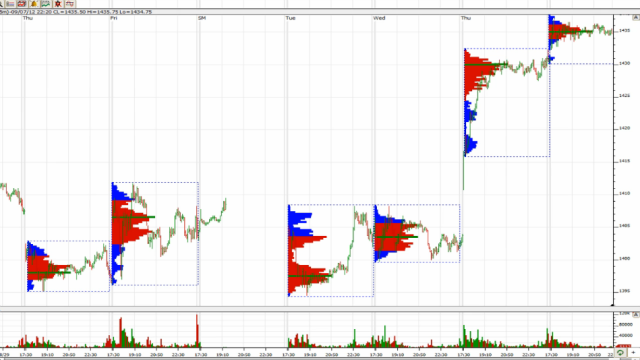
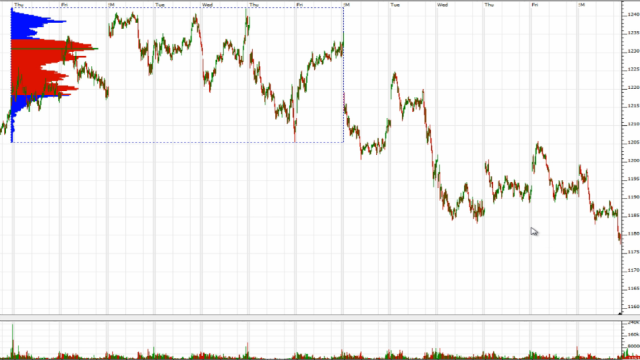
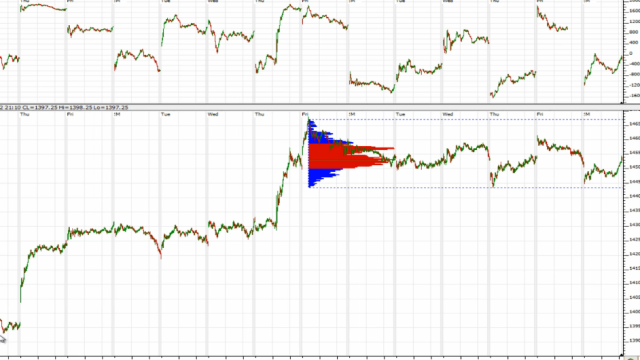
Reading the Market Using Key Reference Areas (Part 2)
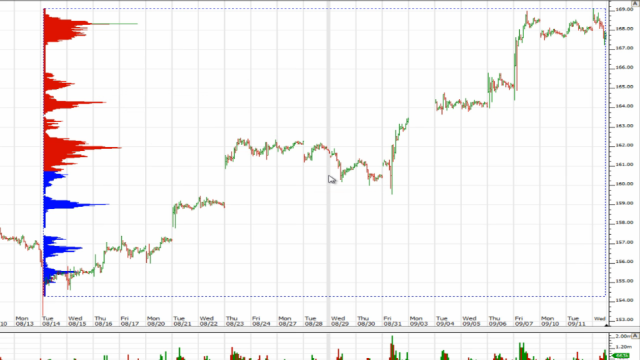
Horizontal volume is a concept few traders understand, and being aware of this key reference area will provide you with a perspective that most will never have. It will give you an ability to read market behavior better, while providing you with a source of key support and resistance levels that prove to be reliable a majority of the time.
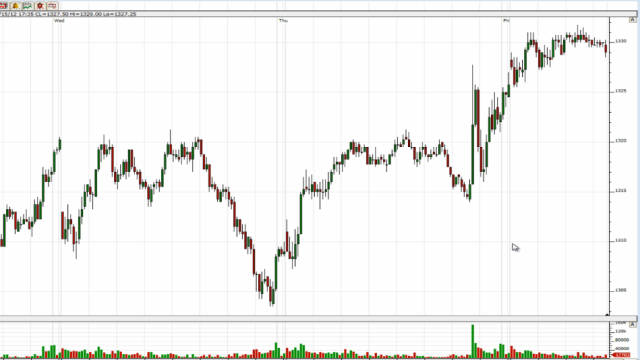
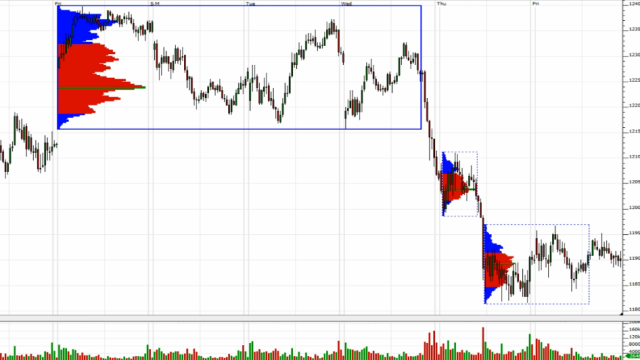
Reading the Market Using Key Reference Areas (Part 3)
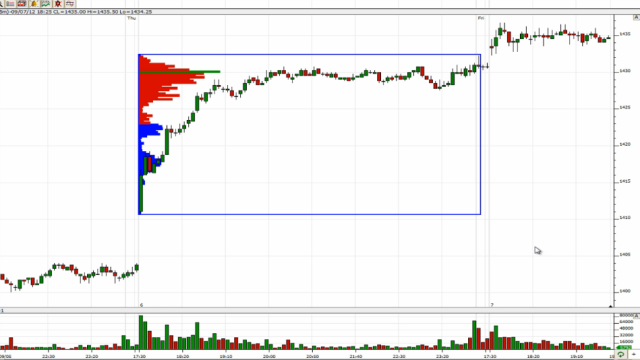
The big money moves the markets and being able to pinpoint areas where the big money entered the markets gives a great reference point from which to judge subsequent market behavior, as well as providing you with key support / resistance that can prove powerful. This session gives you another tool in your arsenal that most traders don’t have insights about.
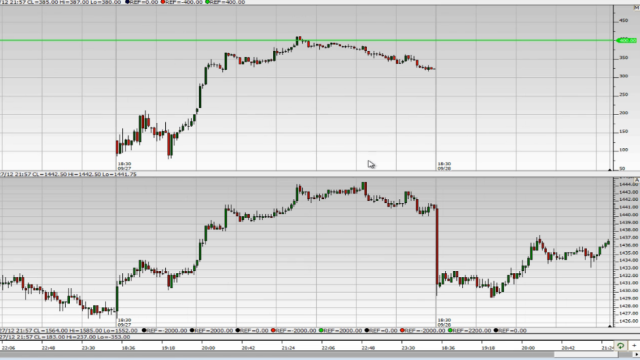
Multiple Time-frame Analysis on the Vertical Dimension
Most traders are trading patterns and mindless setups in a vacuum. They don’t understand the overall context, and as such they make analysis and trading errors. Knowing how to use a top-down multi-timeframe approach will give you the contextual backdrop for analyzing the markets correctly and making better trading decisions.
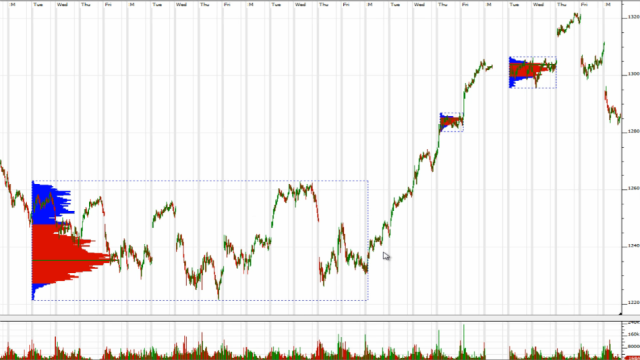
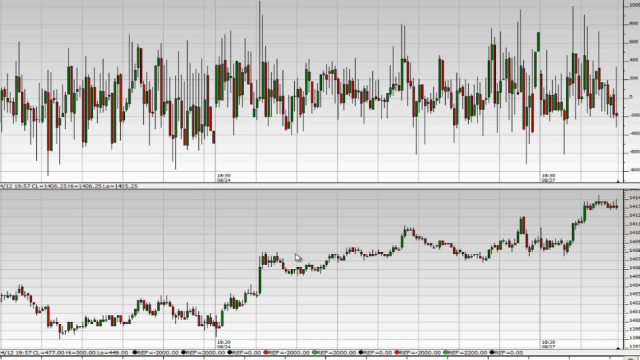
Multiple Time-frame Analysis on the Horizontal Dimension
Having another dimension from which to get a bigger picture contextual view of the market will greatly improve your market reading abilities. It will allow you to be more accurate in your analysis, while being able to identify hidden support and resistance areas on the larger charts that are not obvious to most traders.
Building Your Contextual Market Reading Abilities (Part 1)
This is where your market analysis abilities will take a leap forward. Now you’ll be learning how to tie everything together to be able to not only read what is happening, but to anticipate the odds of different scenarios taking place. This is an essential skill you will need to become a consistently profitable trader.
Building Your Contextual Market Reading Abilities (Part 2)
This will take your market analysis skills a step further and put them into a more actionable form. Flexibility of mind is one of the most important traits a trader can develop, and learning to look at the market dynamically from various time-frames while updating your views on previous and unfolding key reference areas will build a high level of flexibility into your market reading abilities.
The Real Nature of Intraday Market Behavior
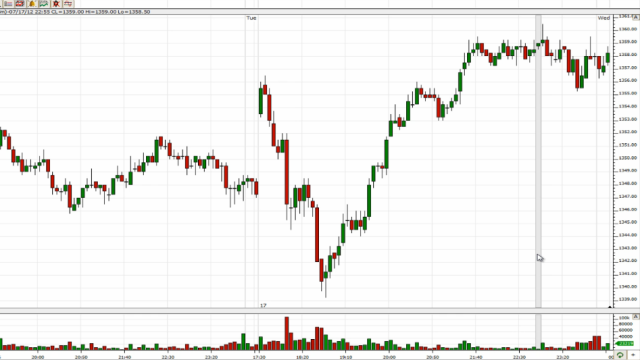
Having logical categories of day types that you can place single market days into takes the complexity of the markets and makes it more manageable and understandable. Being able to identify the day types- especially making an educated guess of it early in the day- while knowing the stats that accompany each type of day, will give you a major edge in reading the markets and eventually in trading them better.
Reading Intraday Market Action in Context
For day traders, few things will improve your trading more than understanding how to anticipate the likely day types based on the larger market context. Knowing how context and key reference areas affect day type, and in turn how day type determines which key reference areas to focus on, will give you a much greater ability to correctly read the markets on an intraday basis.
Looking Under the Hood with Market Internals (Part 1)
If you trade the stock index futures, or individual stocks (or options), understanding market internals (in this case the A/D Line) will give you an edge in properly reading the market. It will allow you to gauge what is happening beneath the surface to gauge the true health of the market, while being able to detect times when the market is unlikely to be able to sustain a price move.
Looking Under the Hood with Market Internals (Part 2)
If you trade the stock index futures, or individual stocks (or options), knowing how to interpret the NYSE TICK will give you an edge in reading the market. You’ll be better able to time reversal points, while having a tool for gauging the conviction of any given price move, to tell you how legitimate and likely to continue it is.
Interpreting Market Internals in Context
For equity index or stock traders, knowing how to combine market internals into your contextual market reads will give you an edge over most traders. While everyone is focusing purely on surface level price and indicators, you’ll be getting a look beneath the surface and increasing the odds of catching great trades, while avoiding the hidden traps in certain types of price action.